Original Research Article
Year: 2017 | Month: Jan.-March | Volume: 1 | Issue: 1 | Pages: 29-43
Assessment of Physico-Chemical Properities of Surface Water, of Oji Town And its Adjoining Areas, Anambra Basin, Se. Nigeria for Irrigation Purpose
M. O. Eyankware1, B. O. Okoeguale2, R. O. E Ulakpa3
1Department of Geology, Faculty of Sciences, Ebonyi State University, Abakaliki, Ebonyi State, Nigeria.
2Department of Applied Biology, Faculty of Biological Sciences, Ebonyi State University,
Abakaliki, Ebonyi State, Nigeria.
3Department of Geography and Meteorology, Faculty of Environmental Science, Enugu State University of Science and Technology, Enugu State, Nigeria.
Corresponding Author: M. O. Eyankware
ABSTRACT
The study tends to assess the quality of surface water for irrigation purpose. The following parameters were test for: PH, Turbidity, Electrical Conductivity, and temperature, Total Dissolved Solid (TDS), Mg2+, SO42-, Cl-, K+, Na2+, HCO3-, Ca2+ and NO3-. PH ranges from (6.0 to 6.9), Turbidity ranges from (0.5 to 2.9 NTU), EC ranges from (34.7 to 60.8µS/cm), temperature ranges from (23 to 290C), TDS ranges from (22.4 to 31.6 mg L-1), magnesium ranges from (1.2 to 3.5 mg L-1/0.09 - 0.21meq/L), sulphate ranges from (2.1 to 12.2 mg L-1/ 0.04 to 0.25 meq/L), chloride ranges from (1.4 to 17.6 mg L-1/ 0.03 to 0.49 meq/L) potassium ranges from (0.9 to 2.6 mg L-1/0.02 to 0.06 meq/L), sodium ranges from (0.3 to 4.3 mg L-1/ 0.01 to 0.18 meq/L), bicarbonate ranges from (30.8 to 66.7 mg L-1/ 0.5 to 1.09 meq/L), calcium ranges from (4.2 to 12.6 mg L-1/ 0.34 to 0.62 meq/L) and nitrate ranges from (0.0 to 26.0 mg L-1 / 0 to 0.41 meq/L). Calculated indices such a SAR, MAR, PI, TH, RSBC, Kelly ratio SSP and CAI indicate that majority of the water are suitable for irrigation. All the sampled values of Na% are excellent for irrigation purpose except for OJI/02 and OJI/06. The water qualities satisfy the condition for use in irrigation. From the Piper an Schoeller diagrams it reveals that OJI/01 is of Ca-HCO3-NO3 water type, OJI/02 - 07 are of Ca- HCO3-Cl water type, OJI/08 is of Mg- HCO3-Cl-SO4 water type, while OJI/09 and OJI/10 are of Ca-Mg- HCO3-Cl with HCO3 as the dominat ionic specie found in all the water samples.
Key words:Ajali Formation, Nsukka Formation, Irrigation, Water Quality and Oji.
INTRODUCTION
Oil production in Nigeria has been a major engine driving the economy of the country, but since the pass one and a half year the price of crude oil has drastically drop in global market and this has lead to economic recession in Nigeria. Both the executive and legislative arm of government has been drumming support for diversification of the nation economy to agriculture. And for this to happen all hand must be on desk to rebuild the economy. Government herself must be serious to introduce mechanized farming and irrigation close to farm settlements so as to provide water all year round for the crop as water is the most important input required for plant growth. Water of good quality has the potential to allow high yield of crops under good soil and water management conditions. Globally chemical contaminants are present in water which could possibly threaten the use of water for domestic and other uses(Eyankware, et al., 2015). Waste from anthropogenic activities (Leachate) also has varying degrees of pollution on water resources (Eyankware, et al., 2015; Moses, et al., 2016). Hence, the need to access the hydrogeochemical quality of water resources from available surface water for irrigation purpose. It is also necessary to increase awareness of the fact that clean environment is necessary for smooth living and also keep water resources free from pollution (Eyankware, et al., 2016). Irrigated agriculture dependent on an adequate water supply of usable quality. In irrigation water evaluation, emphases are placed on the chemical and physical characteristics of the water and only rarely are any other factors considered important (Dhirendra, et al., 2009). The irrigation water is paramount in assessment of irrigation schemes and especially in the saline or alkaline conditions in irrigated areas. Water quality could have a profound impact on crop production; low quality water for irrigation can impose a major environmental constraint to crop productivity. All irrigation water contains dissolved mineral salts, but the concentration and composition of the dissolved salts vary depending on the water source (Stephen, 2002).
Although study and research over the last few years have led to understanding the degrading of water quality and thus has brought to forefront the consequences within Oji and its environs (Egboka, 1985; Eyankware, et al., 2014; Eyankware, et al., 2015). But assessment of water quality for irrigation purpose has not carried out within the study area. This paper is gear towards providing a meaningful guide to quality of water that can be used for irrigation purpose.
Location, Accessibility and Climate
The study area is located in Oji River Local Government Area of Enugu state, Nigeria a semi urban area. The area has a landmass of approximately 403 km² and a population of 126,587 at the 2006 census. The area is made up of village namely: Ojinator, Ugwuoba, Achi, Egbagu, Upkata and Agbalengi. Geographically it is located in latitude 6014lN-6020lN and longitude 7017lE-7021lE. The total annual rainfall ranges from 1600m to more than 2000m, the inversion in the tropical air mass causes convectional rainfall. The area falls within the tropical rainforest belt of Nigeria with temperature ranges from 280C to 320C. The scarp slope is gullied more intensely than the dip slope. Two main seasons exist in Nigeria: the dry season (October to March) and the rainy season (March to October). The Saharan air mass causes the dry season as it advances southwards while the Atlantic Ocean air mass causes the rainy season as it moves northwards. The average annual rainfall for Enugu is about 2000 mm. It occurs as conventional rain that alternates in quick succession between short sunny and rainy conditions. The area is ravaged by soil and gully erosion on both sides of the escarpment (Egboka, et al., 1984; Egboka, et al., 1985; Floyd, 1965; Ofomata, 1965; Ogbukagu, 1976). The rainfall occurs often as violent downpours. This may be accompanied by thunderstorms, heavy flooding, soil leaching, erosion, gullying, and groundwater recharge. The urbanized nature of Enugu area encourages intense runoff and environmental pollution. Around coal mines, waste dumps provide leachates that are pollutants.
Geology and Hydrogeology of the Study Area
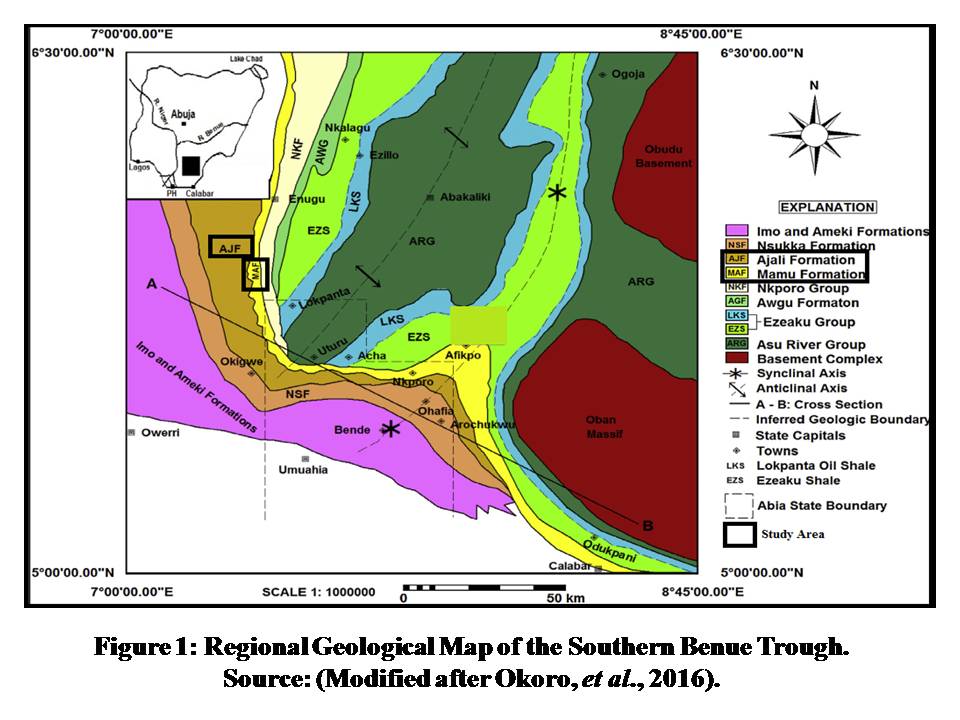
The failed arm of the triple radial rift system involving the separation of the South African and African Continents gave birth to the southern section of NE/SW aulacogen (Oladele, 1975). Stages of sedimentations in the trough were in three cycles; the Pre-Cenomanian deposit of Asu River Group followed by the Cenomanian-Santonian sedimentation. According to Hogue (1977) the inversion tectonics of the Abakaliki anticlinoria which lead to the evolution of both Afikpo Syncline and Anambra basin, represented the third cycle of sedimentation which produced the incipient Nkporo shale, Enugu shale and Owelli sandstone. The Nkporo group is overlain conformably by the Coal Group consisting of the Mamu, Ajali and Nsukka Formations that forms the terminal units of the Cretaceous series (Fig. 1 & Table 1). By sequence, Ajali Formation which is about 330m thick is underlain by Mamu and Nkporo Formations that are 400 and 200 m thick, respectively. The Ajali Formation is typically characterized by white coloured sandstone (Reyment, 1965) while the Mamu Formation is essentially composed of sandy shale and some coal seams whereas; the Nkporo Formation consists mainly of grey - blue mudstone and shale with lenses of sandstone (Obaje, 2009). According to Reyment (1965), the prevailing unit of Ajali Formation consists of thick, friable, poorly sorted sandstone. The major water body in the area is the perennial, well-aerated and fast-flowing Oji River, a tributary of the Anambra River, which itself is a major tributary of the lower Niger River. Many rivers and streams traversing the Udi Hill escarpments flow into Oji River with tributaries Nwangele Stream, Agu Spring.
Table 1: Correlation Chart for Early Cretaceous Tertiary Strata in the Southeastern Nigeria (After Nwajide, 1990)
| Age | Abakaliki – Anambra Basin | Afikpo Basin | |
| M.Y 30 | Oligocene | Ogwashi- Asaba Formation | Ogwashi- Asaba Formation |
| 54.9> | Eocene | Ameki/Nanka Formation, Nsgube Sandstone (Ameki Group) |
Ameki Formation |
| 5.5 | Paleocene | Imo Formation Nsukka Formation |
Imo Formation Nsukka Formation |
| 75 | Maastrichian | Ajali Formation Mamu Formation |
Ajali Formation Mamu Formation |
| 83 – 87.5 | Campanian | Nkporo, Owelli/ Enugu Shale | Nkporo Shale/ Afikpo Sandstone |
| Santonian | Agbani Sandstone /Agwu Shae | Non Deposition erosion | |
| 88.5 | Coriacian | Eze- Aku Group (Incl. Amasiri Sandstone) |
|
| Turonian | Eze- Aku Group | ||
| 93 –100 | Cenomanian-Albian | Asu River Group | Asu River Group |
METHODOLOGY
Table 2: Method of Analysis for Physical and Chemical Parameters.
| Parameters | Standard Test Method | Description of Method |
| Turbidity (NTU) | APHA 214A < | Turbidity Meter |
| PH | ASTM D1293 | PH Meter |
| Temp(0C) | Thermometers | |
| EC (µS/cm) | APHA 145 | Conductivity Meter |
| (TDS) (mg L-1) | APHA 2080 | TDS Meter |
| Sodium(mg L-1) | ASTM D93 – 77 | ASS |
| Potassium(mg L-1) | ASTM D93 – 77 | ASS |
| Magnesium(mg L-1) | ASTM DS 11 | ASS |
| Chloride(mg L-1) | Titration | Titration |
| Bicarbonate(mg L-1) | Titration | Titration |
| Calcium(mg L-1) | ASTM 93 -77 | ASS |
| Nitrate(mg L-1) | APHA 419C | Diazotization |
| Sulphate(mg L-1) | APHA 427C | Colorimetric |
A total of ten water samples were collected from different rivers traversing different communities (Table 10).
Statistical analyses
The results from laboratory were subjected to relevant descriptive statistical analyses to establish relationship and variation using (SPSS software).
RESULTS AND DISCUSSION
Physical Parameters
Turbidity
The value of turbidity ranges from 0.5 to 2.9 NTU with mean value of 1.33 NTU (Table. 4 & 5).
PH
The value of PH ranges from 6.0 to 6.9 with mean value of 6.28 (Table. 4 & 5). The pH values for ten sampling points of the irrigation scheme is in normal to neutral range (pH = 6.5 - 8.5) and below (FAO, 1985) limit. Water suitable for irrigation must have pH range of 6.5-8.4 (Bauder, et al., 2010).
Temperature (0C)
The value ranges from 34.7 to 60.20C with mean value 25.20C (Table. 4 & 5).
Electrical Conductivity (µS/cm)
Electrical conductivity ranges from 34.7 to 60.2 µS/cm with mean value of 48.2 µS/cm (Table. 4 & 5) The most significant water quality guideline on crop productivity is the water salinity hazard as measured by electrical conductivity (Johnson, et al., 1990).
Total Dissolved Solid (TDS)
Total dissolved solid has a mean value of 1.58 with value ranging from 0.3 to 4.3 mg L-1. Total Dissolved solid ranges from 22.4 to 31.6 mg L-1(Table. 4 & 5). According to WHO, (1996) any TDS value less than 300 signify that the TDS concentration is classified as excellent as shown in Table 3. Total Dissolved solids (TDS) are index of the amount of dissolved substances in the water (McNeely et al; 1979). In natural water dissolved solids are composed of carbonates, bicarbonates, chlorides, sodium, sulphate magnesium and phosphate. Concentrations of dissolved solids are important parameter in drinking water.
Table 3: Showing Total Dissolved Solid (TDS) rating according to WHO, (1996)
| Level of TDS (mg L-1) | Rating | Number of Sample | Remarks |
| Less than 300 | Excellent | 10 | All samples >300 |
| 300 – 600 | Good | 10 | NVWR |
| 600 – 900 | Fair | 10 | NVWR |
| 900 – 1000 | Poor | 10 | NVWR |
| Above 1000 | Unacceptable | 10 | NVWR |
Source: Taste of Water with Different TDS Concentrations;
www.who.int/water_sanitation_health/dwq/chemicals/tds.pd
NVWR: No Value within the Range.
Sodium (Na+)
The value of Na+ ranges 0.3 to 4.3 mg L-1 with mean value of 1.58 mg L-1(Table. 4 & 5). Sodium ions are generally highly soluble in water and are leached from the terrestrial environment to groundwater and surface water. They are nonvolatile and will thus be found in the atmosphere only in association with particulate matter (WHO, 1996).
Potassium (K+)
Potassium is an essential element for both plants and animals. The value of K+ ranges 0.9 to 2.6 mg L-1 with mean value of 1.73 mg L-1(Table. 4 & 5).
Chloride (Cl-)
The value of Cl- ranges 1.4 to 17.6 mg L-1 with mean value of 11.86 mg L-1 (Table. 4 & 5).Chloride ions are generally present in natural waters and its presence can be attributed to dissolution of salts.
Calcium (Ca2+)
Calcium is a major constituent of most Igneous rock, metamorphic and sedimentary rocks. The principal sources of calcium in groundwater are some members of the silicate minerals such as pyroxenes, amphiboles among igneous and metamorphic rocks, and limestone, dolomite and gypsum among sedimentary rocks (Ideriah, 2015). The value of calcium ranges from 4.4 to 12.6 mg L-1 with mean value of with mean value of 10.34 mg L-1(Table. 4 & 5).
Magnesium (Mg2+)
Magnesium is the fourth most abundant cation in the body and the second most abundant cation in intracellular fluid. The value of magnesium ranges from 1.2 to3.5 mg L-1 with mean value of 2.0 mg L-1 (Table. 4 & 5).
Bicarbonate (HCO3-)
HCO3- has mean value of 52.3 mg L-1 with value ranging from 30.8 to 57.7 mg L-1(Table. 4 & 5). Bicarbonate combines with calcium carbonate and sulphate to form heat retarding, pipe clogging scale in boilers and in other heat exchange equipment. The source of bicarbonate irons in ground water is from the dissolution of carbonate rocks and from carbonate species present and the pH of the water is usually between 5 and 7 (Taylor, 1958).
Nitrate (NO3-)
Nitrate is naturally occurring ions that are part of the nitrogen cycle. The nitrate ion (NO3-) is the stable form of combined nitrogen for oxygenated systems. Although chemically unreactive, it can be reduced by microbial action (WHO, 1996). Ranges from 0.0 to 26.0 mg L-1 with mean value of 2.97 mg L-1 (Table. 4 & 5). In soil, fertilizers containing inorganic nitrogen and wastes containing organic nitrogen are first decomposed to give ammonia, which is then oxidized to nitrite and nitrate. The nitrate is taken up by plants during their growth and used in the synthesis of organic nitrogenous compounds. Surplus nitrate readily moves with the groundwater (USEPA, 1987; Van, et al., 1989).
Sulphate (SO42-)
Sulphate is a naturally occurring substance that contains sulphur and oxygen. Sulphate value ranges from 2.1 to 12.2 mg L-1 with mean value of 3.30 mg L-1(Table.4 & 5). Sulphate occurs in water as the inorganic sulphate salts as well as dissolved gas. Sulphate is not a noxious substance although high sulphate in water may have a laxative effect
IRRIGATION QUALITY PARAMETERS
Irrigated agriculture is dependent on an adequate water supply of usable quality. Just as every water is not suitable for human beings, in the same way, every water is not suitable for plant life. Water containing impurities, which are injurious to plant growth, is not satisfactory for irrigation, and called unsatisfactory water (Nata, et al., 2011).The quality characteristics studied in the present investigations were as follows: Electrical conductivity (EC) Soluble sodium percentage (SSP) Magnesium adsorption ratio (MAR), sodium percentage (Na%), Sodium adsorption ratio (SAR), Kelly ratio (KR), Pollution Index (PI) and Chloro alkaline Indices (CAI)
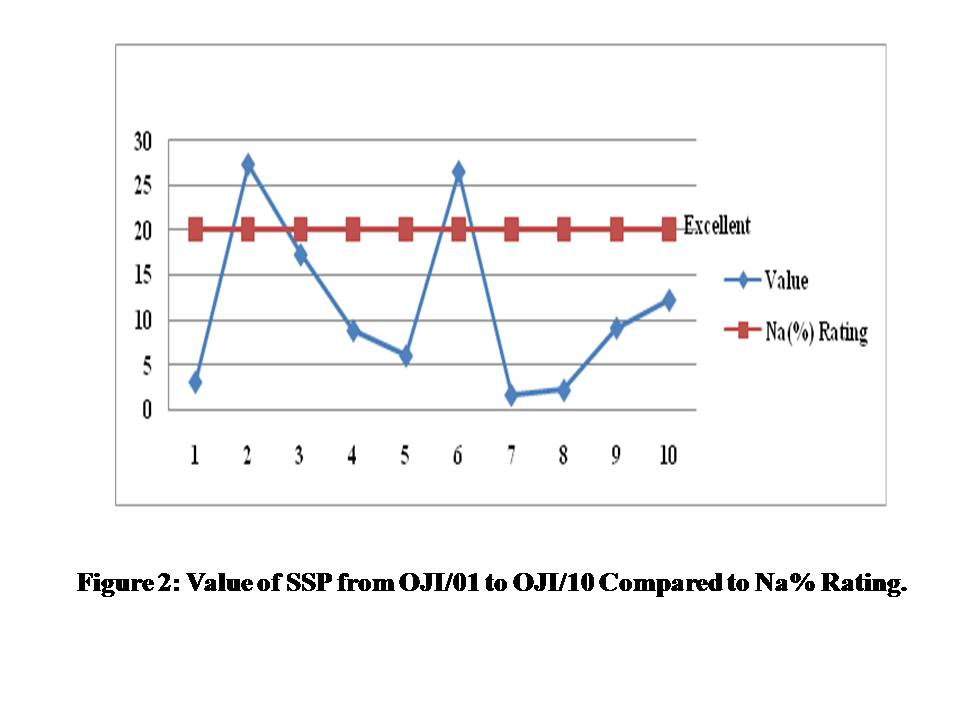
Sodium Percentage (SP)
Sodium percentage is an important criterion for defining the type of irrigation. It is another important factor to study sodium hazard. The value of Na% ranges from 1.65 to 27.27% with mean value of 11.39% (Fig.2 &Table. 8). All the sampled values of Na% are classified excellent for irrigation purpose except for OJI/02 and OJI/06 which classified good (Table 11). Na % was calculated by using (Doneen, 1964) formula:
Where all ionic concentration is expressed in meq/L
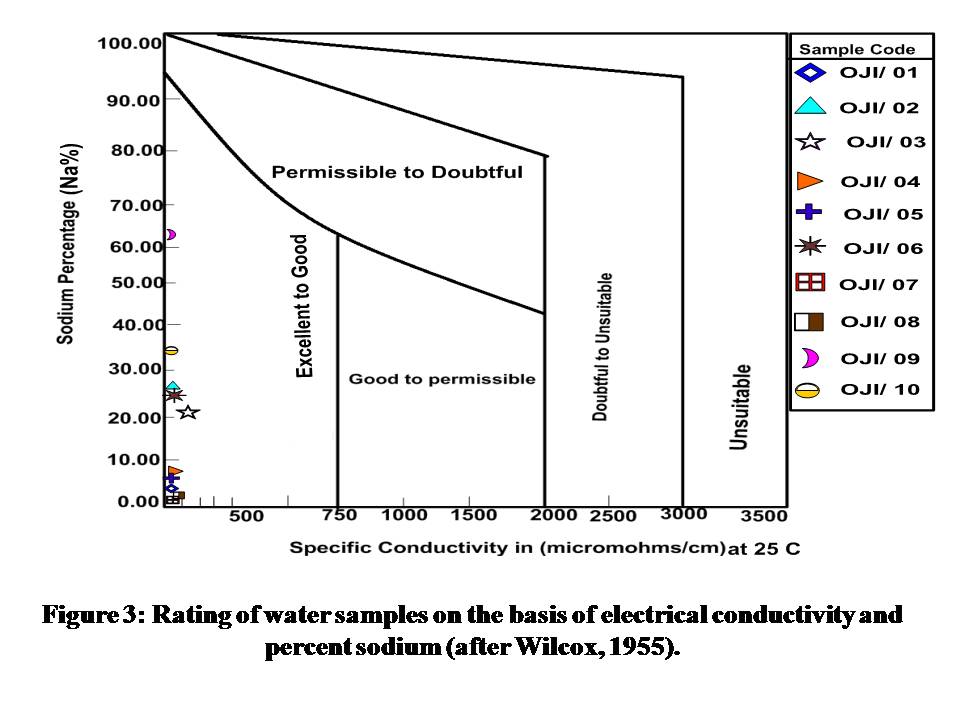
The Wilcox, (1955) diagram relating sodium percentage and electrical conductivity shows that 100% of the groundwater samples fall within excellent to good OJI/01 to 10 (Fig.3). This implies that the water is fit for irrigation purpose.
Figure 2: Value of SSP from OJI/01 to OJI/10 Compared to Na% Rating.
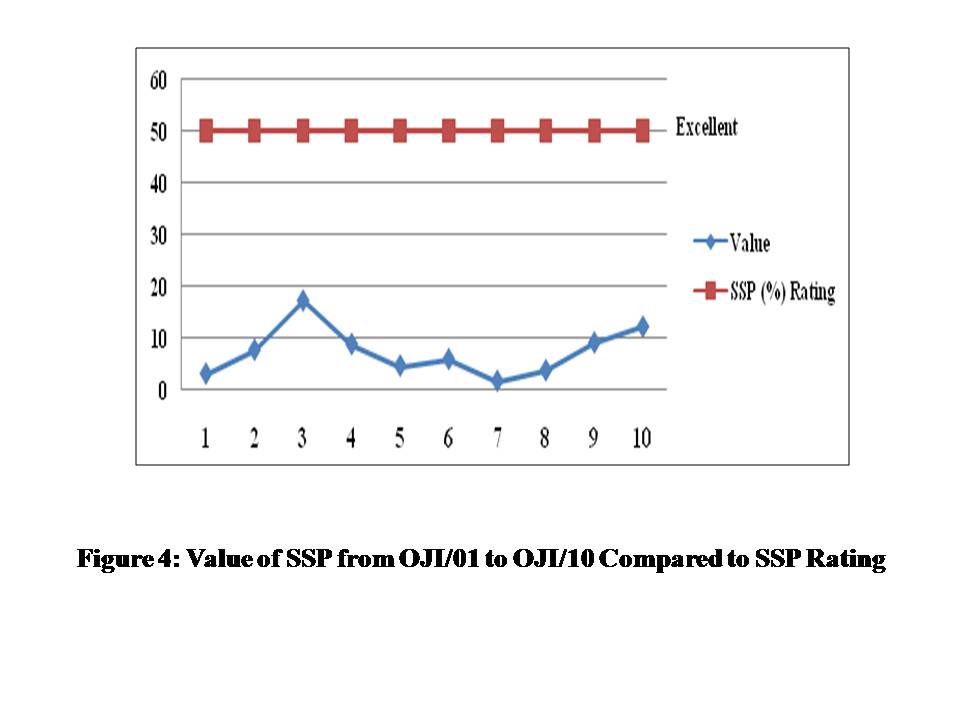
Soluble sodium percentage (SSP)
The values of SSP less than 50 indicates good quality of water and higher values shows that the unacceptable quality of water for irrigation (USDA, 1954). SSP value ranges from 1.66 to 17.24% with mean value of 7.39% (Fig. 4 &Table 8). The water samples are suitable for irrigation purpose because SSP value is less than 50 (Table 10).
SSP calculated by using Todd, (1980).
Equation 2
Where all ionic concentration is expressed in meq/L
Figure 4: Value of SSP from OJI/01 to OJI/10 Compared to SSP Rating
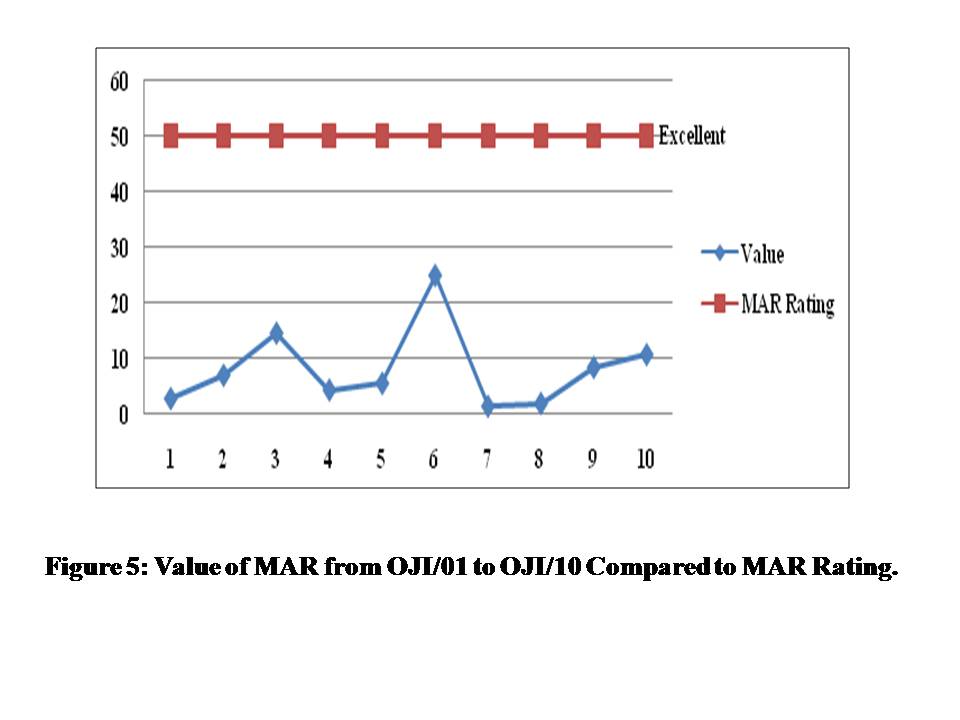
Figure 5: Value of MAR from OJI/01 to OJI/10 Compared to MAR Rating.
Magnesium Adsorption Ratio (MAR)
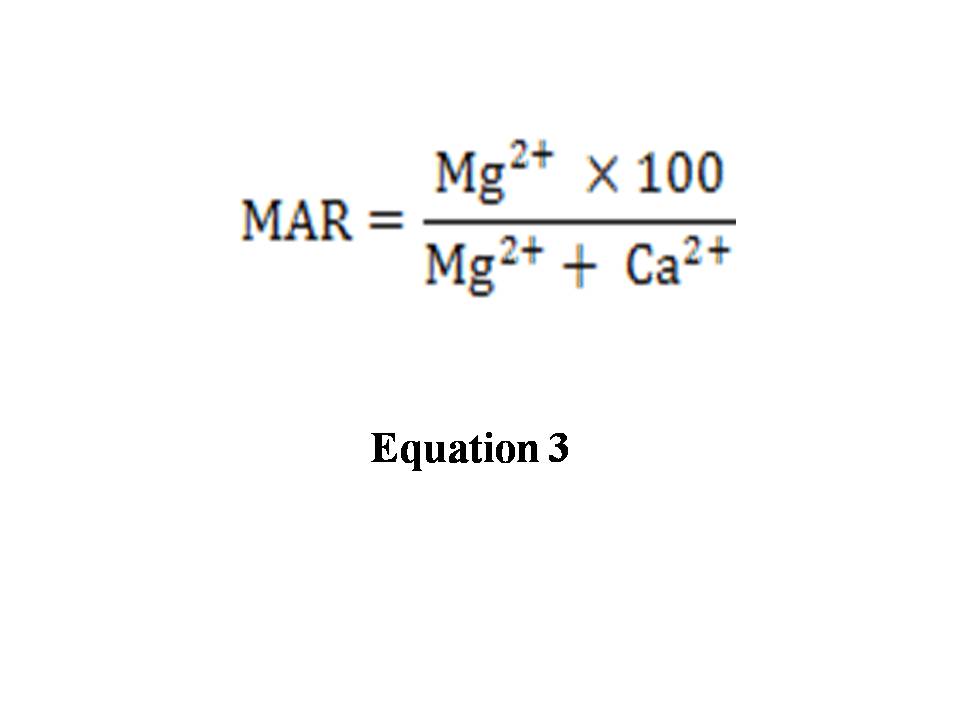
Generally, calcium and magnesium maintain a state of equilibrium in most waters. High magnesium in water will adversely affect crop yields as the soil becomes more saline (Joshi et al, 2009). The value of MAR ranges from 1.61 to 25.00with mean value of 8.32. Based on the value of MAR the water is fit for irrigation purpose (Fig.5; Table 8 & 10). More magnesium in water will adversely affect crop yields as the soils become more alkaline. Value below 50 is considered the acceptable limit of MAR (Ayers & Westcot, 1994). The Magnesium Adsorption Ratio was calculated using the following equation (Raghunath, 1987):
Equation 3
Where all ionic concentration is expressed in meq/L
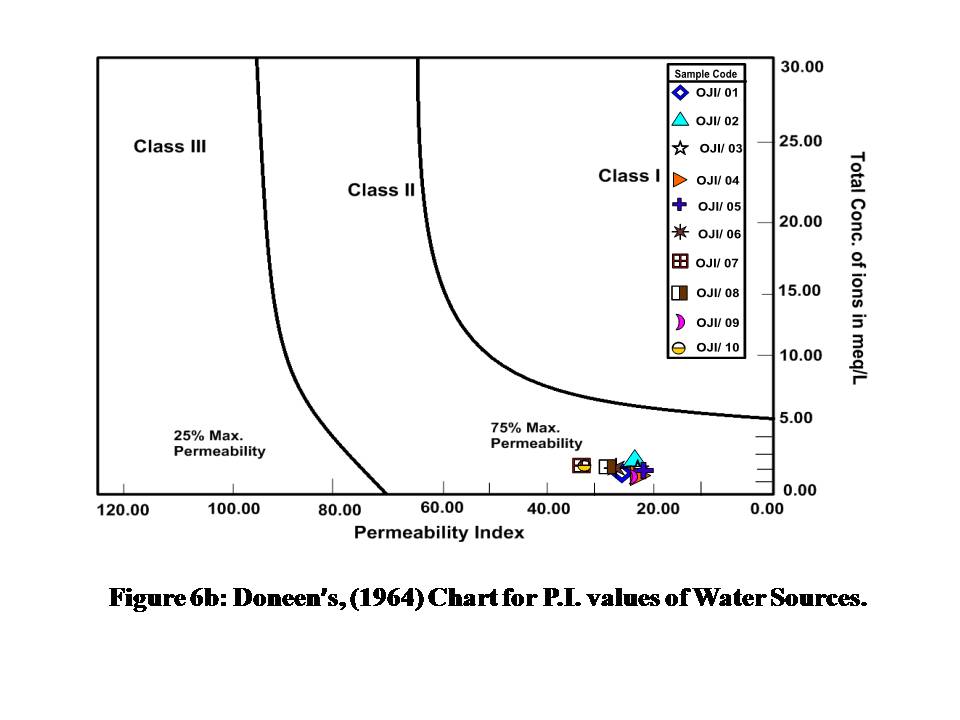
Permeability Index (P.I.)
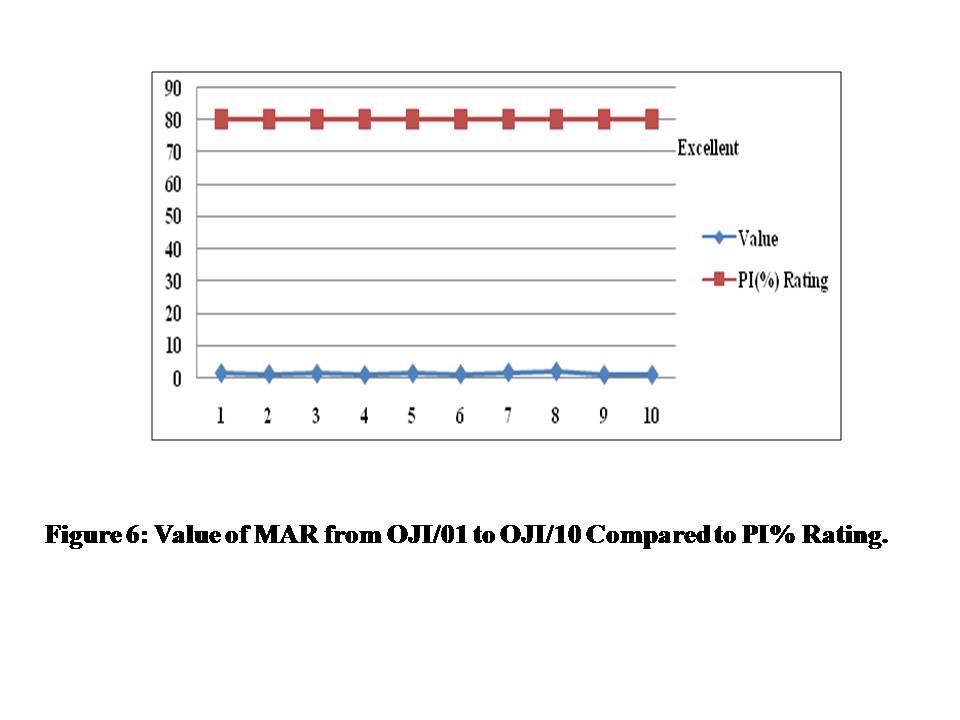
Doneen, (1964) evolved a criterion for assessing the suitability of water for irrigation based on the permeability index. The value of PI ranges from 0.3 to 0.54 with mean value of 0.54 (Fig.6 & Table 8). Based on value range of PI the water is fit for irrigation purpose (Table 7&10). PI was calculated based on Domenico, et al., (1990).
Equation 4
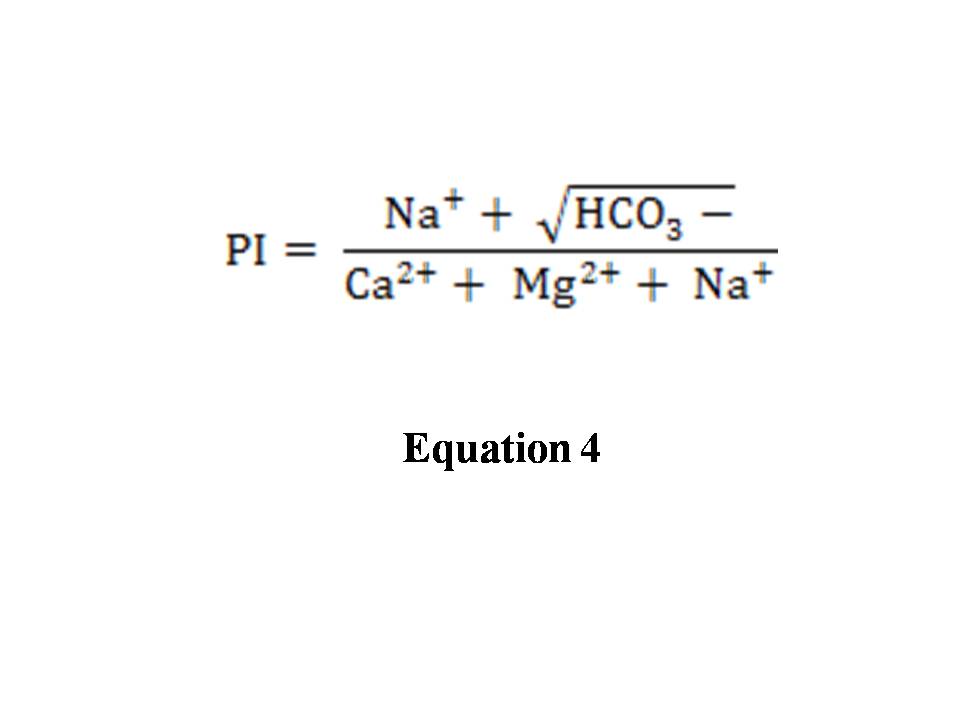
Where all ionic concentration is expressed in meq/L
Figure 6: Value of MAR from OJI/01 to OJI/10 Compared to PI% Rating.
Figure 6b: Doneen’s, (1964) Chart for P.I. values of Water Sources.
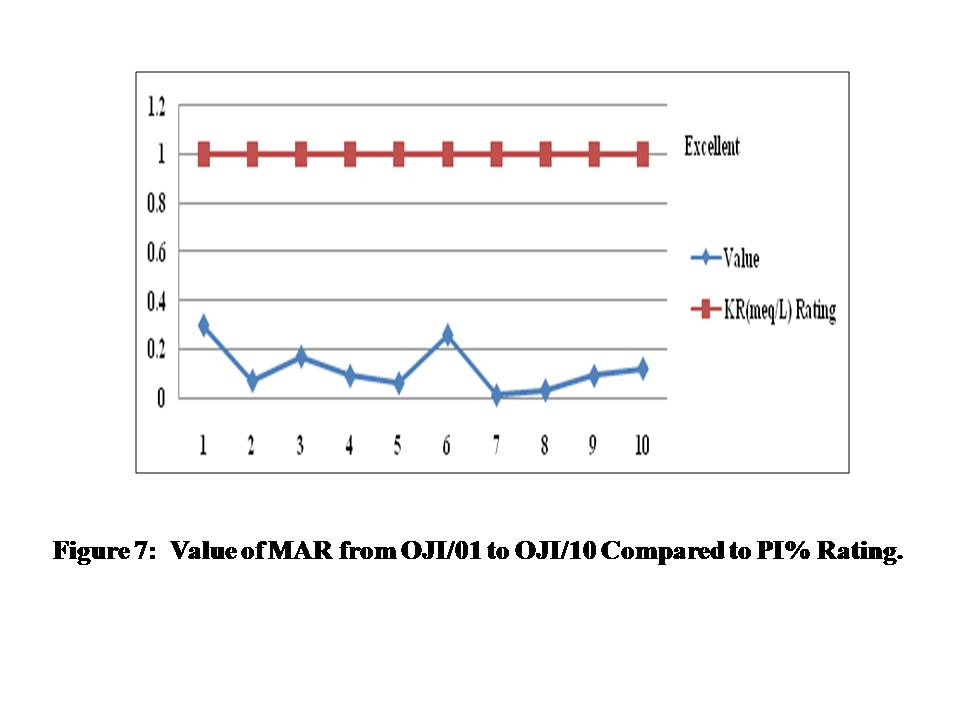
Figure 7: Value of MAR from OJI/01 to OJI/10 Compared to PI% Rating.
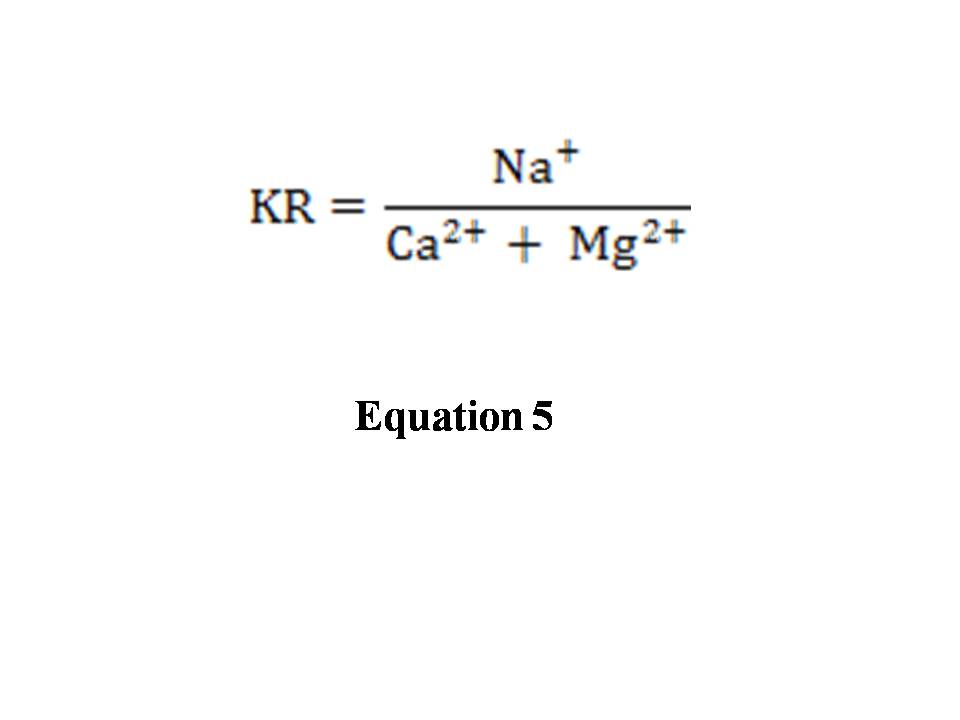
Kelly Ratio (KR)
Kelley’s Ratio of more than one (1meq/l) indicates an excess level of sodium in waters. Hence, waters with a Kelley’s Ratio less than one are suitable for irrigation (Aher and Deshpande, 2011). The value of KR ranges from to 0.01 with 0.30 mean value of 0.12. Based on the value the water is suitable for irrigation purpose (Fig.7; Table 8 & 10). This was calculated employing the equation (Kelly, 1963) as:
Equation 5
Where all ionic concentration is expressed in meq/L
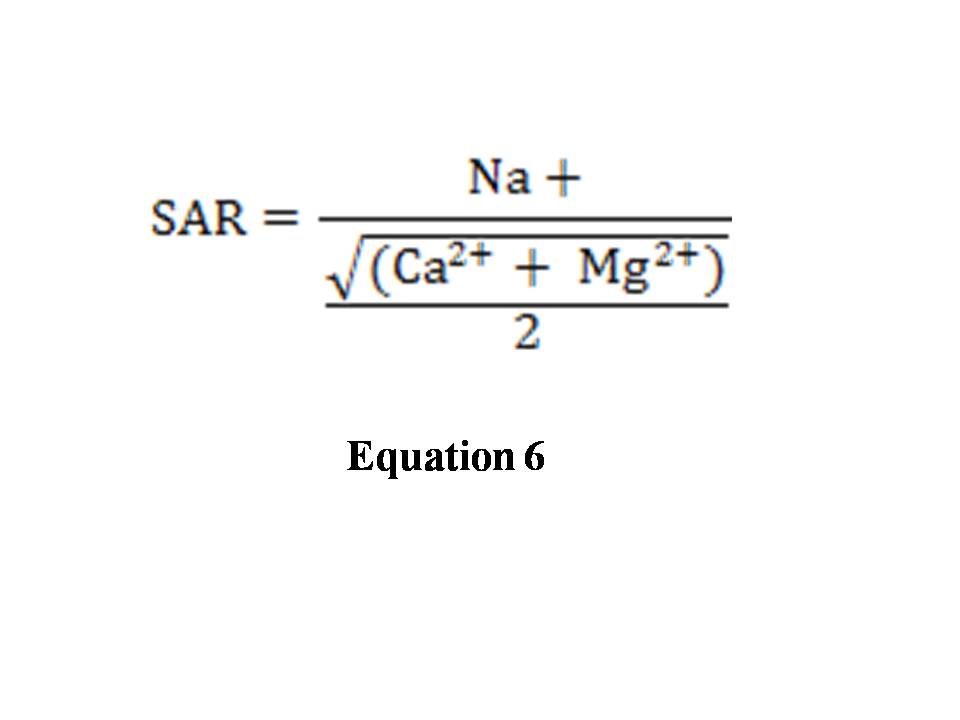
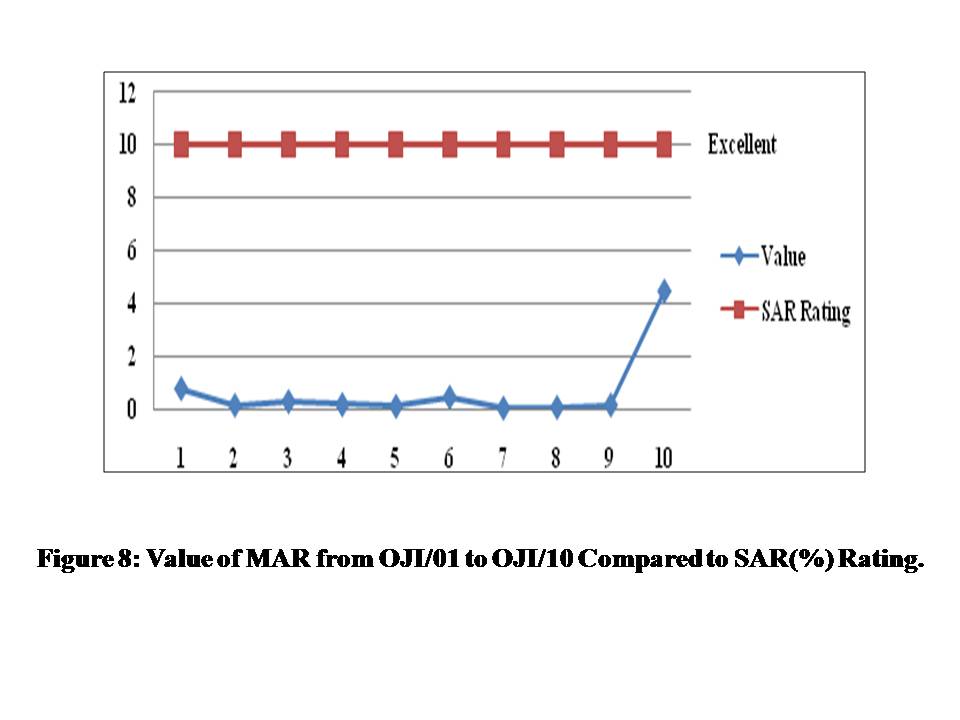
Sodium Adsorption Ratio (SAR)
SAR is an easily measured property that gives information on the comparative concentrations of Na+, Ca2+, and Mg2+ in the water samples (Talabi, et al., 2014). SAR takes into consideration the fact that the adverse effect of sodium is moderated by the presence of calcium and magnesium ions. When the SAR rises above 12 to 15, serious physical soil problems arise and plants have difficulty absorbing water (Munshower, 1994, Brady, 2002). The value of SAR ranges from 0.05 to 0.23 with mean value of 0.65 (Fig. 8 & Table 8) Based on this the value of SAR. The water is fit for irrigation purpose. This was calculated employing the equation (Raghunath, 1987) as:
Equation 6
Where all ionic concentration are expressed in meq/L.
From the US Salinity diagram OJI/01 to OJI/10 are classified as S1 for SAR and C1 for electrical conductivity. This implies that the water is excellently suitable for irrigation based on CGWB and CPCB (2000) Guidelines for evaluation of irrigation water quality.(Fig.9 and Table 10)
Figure 8: Value of MAR from OJI/01 to OJI/10 Compared to SAR(%) Rating.
Figure.9: Classification of water based on US salinity diagram.
Total Hardness (TH)
TH value ranges from 5.00 to 41.00 with mean value of 30.82 (Table. 8). Hence the water can be classified as soft water based on Sawyer, et al., (1967) see Table. 9. TH was calculated by the following equation (Raghunath, 1987):
Equation 7
Where all ionic concentration is expressed in meq/L
Residual Sodium Bi-carbonate (RSBC)
Residual sodium bicarbonate (RSBC) exists in irrigation water when the bicarbonate (HCO3-) content exceeds the calcium (Ca2+) content of the water. Where the water RSBC is high (>2.5meq/L), extended use of that water for irrigation will lead to an accumulation of sodium (Na) in the soil. This may results in (i) Direct toxicity to crops, (ii) Excess soil salinity (EC) and associated poor plant performance, and (iii) Where appreciable clay or silt is present in the soil, loss of soil structure occur through clogging of pore spaces thereby hindering air andwater movement (SAI, 2010; Naseem, et al., 2010). The value of RSBC ranges 0.05 to 0.87 with mean 0.38 (Table. 8) indicating good quality for irrigation purpose. RSBC was calculated according to proposed formula by Gupta and Gupta (1987):
Equation 8
Where all ionic concentration is expressed in meq/L
Chloro alkaline Indices (CAI)
The CAI is essential to know the changes in chemical composition of groundwater during its travel in the sub-surface. The Chloro-alkaline indices CAI suggested by Schoeller, (1977) which indicate the ion exchange between the groundwater and its host environment. CAI value ranges from -0.66 to 0.91 with mean value of 0.48 (Table 8). If CAI is negative, there will be an exchange between Na + K with calcium and magnesium (Ca + Mg) in rocks. If the ratio is positive (OJI/02, 03, 04, 06, 07, 08, 09 and 10) there is no base change in CAI see Table 8. The positive value indicates the absence of Base Exchange. The negative value of the ratio (OJI/01 and 05) indicates Base Exchange between sodium and potassium in water with calcium and magnesium in the samples (Jafar, et al., 2013).
The Chloroalkaline indices used in the evaluation of Base Exchange are calculated using the below equations.
Equation 9
Where all ionic concentration is expressed in meq/L
Table 4: Result of analyzed Physical and Chemical Parameters
| Parameters | OJI/01 | OJI/02 | OJI/03 | OJI/04 | OJI/05 | OJI/06 | OJI/07 | OJI/08 | OJI/09 | OJI/10 |
| Turbidity (NTU) | 2.0 | 0.9 | 0.8 | 0.7 | 0.8 | 0.9 | 0.5 | 1.5 | 2.3 | 2.9 |
| PH | 6 | 6 | 6.4 | 6.5 | 6.5 | 6.3 | 6.9 | 6.0 | 6.2 | 6.0 |
| EC (µS/cm) | 56.0 | 43.8 | 52.2 | 43.8 | 46.5 | 52.5 | 49.1 | 52.4 | 60.2 | 34.7 |
| (TDS) (mg L-1) | 28.0 | 26.9 | 25.1 | 24.2 | 23.3 | 28.3 | 31.6 | 28.2 | 22.4 | 31.5 |
| Na2+(mg L-1) | 0.5 | 1.6 | 2.4 | 1.5 | 0.9 | 4.3 | 0.3 | 0.4 | 1.5 | 2.4 |
| K+(mg L-1) | 1.3 | 1.6 | 1.9 | 2.6 | 1.9 | 1.7 | 2.1 | 1.4 | 1.9 | 0.9 |
| Mg2+ (mg L-1) | 1.2 | 2.0 | 2.0 | 1.6 | 1.5 | 1.3 | 1.3 | 3.2 | 2.4 | 3.5 |
| Cl- (mg L-1) | 1.4 | 8.6 | 8.5 | 12.5 | 10.8 | 14.3 | 13.7 | 14.6 | 17.6 | 16.6 |
| HCO3- (mg L-1) | 62.0 | 62.5 | 44.0 | 30.8 | 60.0 | 60.0 | 56.4 | 66.7 | 32.4 | 48.3 |
| Ca2+ (mg L-1) | 11.3 | 12.6 | 9.6 | 11.2 | 10.8 | 11.7 | 10.1 | 4.2 | 9.6 | 12.3 |
| NO3- (mg L-1) | 26.0 | 0.0 | 0.0 | 0.0 | 0.4 | 1.8 | 0.9 | 0.6> | 0.0> | 0.0 |
| SO42- (mg L-1) | 2.4 | 2.5 | 2.4> | 2.1 | 2.2> | 2.7 | 2.4 | 12.2 | 2.1 | 2.5 |
All concentrations are in mg L-1.
Table 5: Summary of Statistics of Analyzed Physical and Chemical Parameters.
| Parameters | Minimum | Maximum> | Mean | Range | Standard Deviation |
| Turbidity (NTU) | 0.5 | 2.9 | 1.33 | 2.4 | 0.25 |
| PH | 6.0 | 6.9 | 6.28 | 0.9 | 0.30 |
| EC (µS/cm) | 34.7 | 60.2 | 48.2 | 25.5 | 7.1 |
| (TDS) (mg L-1) | 22.4 | 31.6 | 26.9 | 9.2 | 3.1 |
| Na2+(mg L-1) | 0.3 | 4.3 | 1.58 | 4.0 | 1.2 |
| K+(mg L-1) | 0.9 | 2.6 | 1.73 | 1.7 | 0.4 |
| Mg2+ (mg L-1) | 1.2 | 3.5 | 2.0 | 2.3 | 0.8 |
| Cl- (mg L-1) | 1.4 | 17.6 | 11.86 | 16.2 | >4.7 |
| HCO3- (mg L-1) | 30.8 | 66.7 | 52.3 | 35.9 | 12.8 |
| Ca2+ (mg L-1) | 4.2 | 12.6 | 10.34 | 8.4 | 2.3 |
| NO3- (mg L-1) | 0.0 | 26.0 | 2.97 | 26 | 8.1 |
| SO42- (mg L-1) | 2.1 | 12.2 | 3.3 | 10.1 | 3.1 |
All concentrations are in mg L-1.
Table 6: Result of Chemical Parameters
| Parameters | OJI/01 | OJI/02 | OJI/03 | OJI/04 | OJI/05 | OJI/06 | OJI/07 | OJI/08 | OJI/09 | OJI/10 |
| Na2+( meq/L) | 0.02 | 0.06 | 0.10 | 0.06 | 0.03 | 0.18 | 0.01> | 0.01 | 0.06 | 0.10 |
| K+( meq/L) | 0.03 | 0.04 | 0.04 | 0.06 | 0.04 | 0.04 | 0.05 | 0.03 | 0.04 | 0.02 |
| Mg2+ ( meq/L) | 0.09 | 0.16 | 0.16 | 0.13 | 0.12 | 0.16 | 0.10 | 0.15 | 0.19 | 0.21 |
| Cl- ( meq/L) | 0.03 | 0.24 | 0.23 | 0.35 | 0.30 | 0.40 | 0.38 | 0.41 | 0.49 | 0.46 |
| HCO3- (meq/L) | 1.01 | 1.02 | 0.74 | 0.50 | 0.98 | 0.98 | 0.92 | 1.09 | 0.53 | 0.79 |
| Ca2+ (meq/L) | 0.56 | 0.62 | 0.42 | 0.55 | 0.53 | 0.58 | 0.50 | 0.34 | 0.47 | 0.61 |
| NO3- (meq/L) | 0.41 | 0.0 | 0.0 | 0.0 | 0.00 | 0.02 | 0.01 | 0.00 | 0.0 | 0.0 |
| SO42- (meq/L) | 0.04 | 0.05 | 0.04 | 0.04 | 0.04 | 0.05 | 0.04 | 0.25 | 0.04 | 0.05 |
All concentrations are in meq/L.
Table 7: Summary of Statistics of Analyzed Chemical Parameters
| Parameters | Minimum | Maximum | Mean | Standard Deviation |
| Na2+( meq/L) | 0.01 | 0.18 | 0.06 | 0.05 |
| K+( meq/L) | 0.02 | 0.06 | 0.03 | 0.01 |
| Mg2+ ( meq/L) | 0.09 | 0.21 | 0.14 | 0.03 |
| Cl- ( meq/L) | 0.03 | 0.49 | 0.32 | 0.13 |
| HCO3- ( meq/L) | 0.5 | 1.09 | 0.85 | 0.20 |
| Ca2+ ( meq/L) | 0.34 | 0.62 | 0.51 | 0.08 |
| NO3- ( meq/L) | 0 | 0.41 | 0.04 | 0.12 |
| SO42- ( meq/L) | 0.04 | 0.25 | 0.06 | 0.06 |
All concentrations are in meq/L.
Table 8: Analytical results of irrigation water quality parameter
| SAMPLE NO | SPP | MAR | KR | SAR | PI | Na% | TH | RSBC | CAI |
| OJI/01 | 3.07 | 2.98 | 0.30 | 0.76 | 1.52 | 3.07 | 32.50 | 0.45 | -0.66 |
| OJI/02 | 7.69 | 7.14 | 0.07 | 0.13 | 1.26 | 27.27 | 39.00 | 0.40 | 0.91 |
| OJI/03 | 17.24 | 14.70 | 0.17 | 0.27 | 1.41 | 17.24 | 29.00 | 0.32 | 0.39 |
| OJI/04 | 8.82 | 4.51 | 0.09 | 0.15 | 1.02 | 8.82 | 34.00 | 0.05 | 0.65 |
| OJI/05 | 4.61 | 5.73 | 0.06 | 0.09 | 1.48 | 6.00 | 32.50 | 0.45 | -0.13> |
| OJI/06 | 5.88 | 25.00 | 0.26 | 0.43 | 1.22 | 26.47 | 37.70 | 0.40 | 0.45 |
| OJI/07 | 1.66 | 1.61 | 0.01 | 0.025 | 1.77 | 1.63 | 5.00 | 0.87 | 0.84 |
| OJI/08 | 3.69 | 2.12 | 0.03 | 0.05 | 2.10 | 2.17 | 24.50 | 0.75 | 0.90 |
| OJI/09 | 9.09 | 8.57 | .09 | 0.14 | 1.08 | 9.09 | 33.00 | 0.06 | 0.79 |
| OJI/10 | 12.19 | 10.86 | 0.12 | 4.44 | 1.06 | 12.19 | 41.00 | 0.18 | 0.73 |
| Minimum | 1.66 | 1.61 | 0.01 | 0.02 | 1.02 | 1.65 | 5.00 | 0.05 | -0.66 |
| Maximum | 17.24 | 25.00 | 0.3 | 4.44 | >2.10 | 27.27 | 41.00 | 0.87 | 0.91 |
| Mean | 7.39 | 8.32 | 0.12 | 0.64 | 1.39 | 11.39 | 30.82 | 0.39 | 0.48 |
| STDEV | 4.71 | 7.14 | 0.09 | 1.35 | 0.34 | 9.45 | 10.26 | 0.26 | 0.51 |
Table 9: A range of water Total hardness (Sawyer, C.N. and McCarthy, P.L. 1967)
| Index Range | Description | Percentage |
| <60 | Soft | 100% |
| 60 - 120 | Moderately Hard | |
| 120 – 180 | Very Hard |
Table 10: Water Sample Collection Site
| Name of Location | Sample Code |
| Oji River Section I | OJI/01 |
| Nwangele Stream | OJI/02 |
| Ogba Spring | OJI/03 |
| Ago Spring | OJI/04 |
| Izele Stream | OJI/05 |
| Ozom Stream | OJI/06 |
| Oji River Section II | OJI/07 |
| Ugwuoba | OJI/08 |
| ji River Section II | OJI/09 |
| Oji River Section III | 0JI/10 |
Hydrogeochemistry
Piper Trilinear Diagram
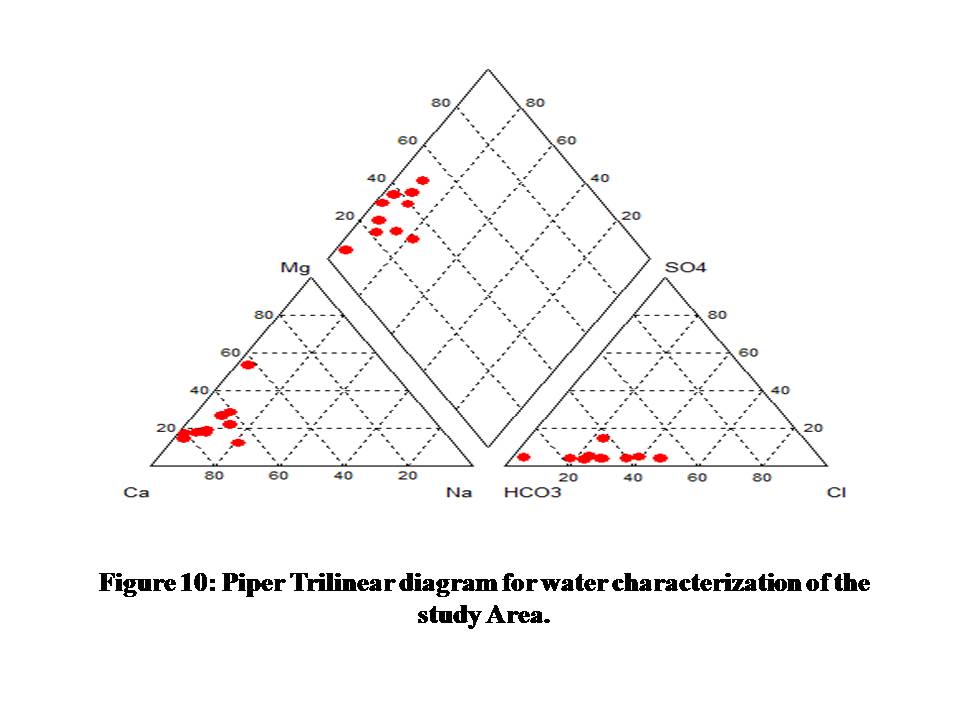
One of the most useful graphs for representing and comparing water quality analyses is the trilinear diagram by Piper shown in Fig.10
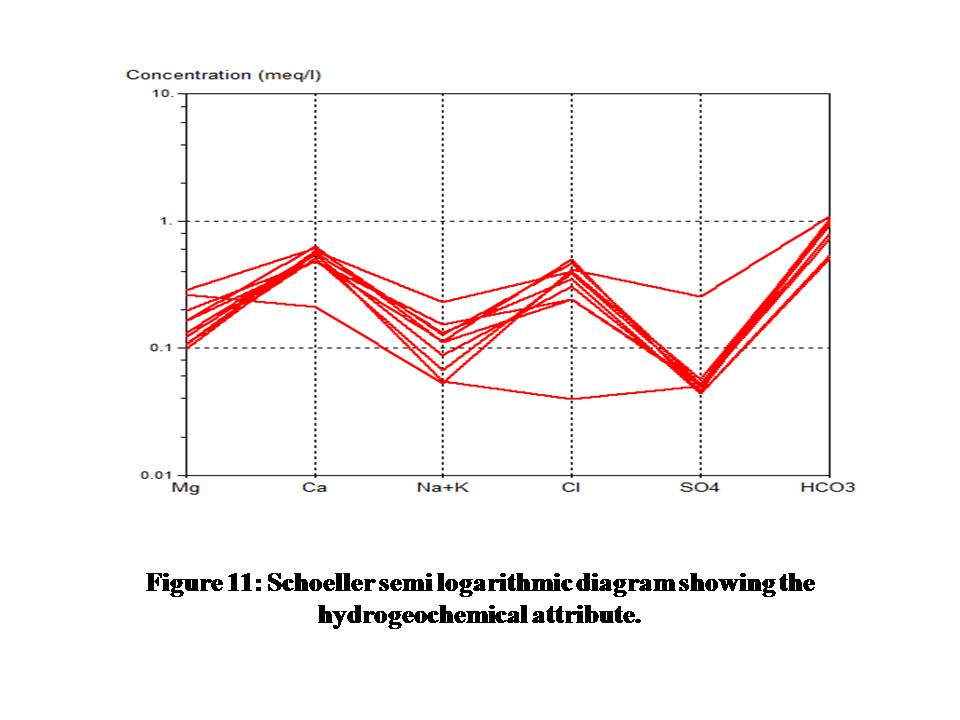
From the Piper an Schoeller diagrams (Fig. 10 & 11) it reveals that OJI/O1 is of Ca-HCO3-NO3 water type, OJI/02 - 07 are of Ca- HCO3-Cl water type, OJI/08 is of Mg- HCO3-Cl-SO4 water type, while OJI/09 and OJI/10 are of Ca-Mg- HCO3-Cl with HCO3 as the dominat ionic specie found in all the water samples.
Figure 10: Piper Trilinear diagram for water characterization of the study Area.
Figure 11: Schoeller semi logarithmic diagram showing the hydrogeochemical attribute.
Table 11: Guidelines for evaluation of irrigation water quality. Source: Modified after CGWB and CPCB (2000).
| Water Class | Na% | SAR | MAR | PI | SSP | KR | EC (µS/cm) |
| Excellent | <20 | <10 | <50 | <80 | 50 | <1.0 | <250 |
| Good | 20-40 | 10-18 | <50 | 250-75 | |||
| Medium | 40-60 | 18-26 | 80-100 | 750-2250 | |||
| Bad | 60-80 | >26 | >50 | 100-120 | 2250-4000 | ||
| Very Bad> | >80 | >26 | >50 | >1.0 | >4000 |
CONCLUSION
The suitability of water in study area was investigated for irrigation and other usability status. Calculated indices such as SAR, Kelly ratio, PI, SSP, RSBC, TH, CAI and MAR was employed to determine its suitability status for irrigation and other agricultural purposes. All the sampled values of Na% are excellent for irrigation purpose except for OJI/02 and OJI/06. From the analysis the water samples satisfy the required quality needed for irrigation and other agricultural uses. From the Piper an Schoeller diagrams (Fig. 10 & 11) it reveals that OJI/O1 is of Ca-HCO3-NO3 water type, OJI/02 - 07 are of Ca- HCO3-Cl water type, OJI/08 is of Mg- HCO3-Cl-SO4 water type, while OJI/09 and OJI/10 are of Ca-Mg- HCO3-Cl with HCO3 as the dominat ionic specie found in all the water samples.
ACKNOWLEDGMENT
The first author is grateful for the support of his mother Mrs. Queen Eyankware for her love and care and to others to numerous to mention who in one way or the other helped in making this research a reality.
REFERENCES
- Aher, K. R., and Deshpande, S.M. (2011): Assessment of water Quality of the maniyad Reservoir of parala village, district Aurangable: Suitability for multipurpose usage. Inter, Journal of Recent trend in science and technology. 1. Pp. 9-95.
- American Public Health Association APHA (1992). Standard methods for Examination of water and waste water, 17th ed; 1268 -1270.
- Ayers, R S., and Westcot, D.W. (1994) Water quality for agriculture: FAO Irrigation and Drainage Paper 29. Revision 1. 1-130.
- Bauder T.A, Waskom R.M. and Davies J.G, (2010), Irrigation water quality, Colorado State University Extension
- Brady, N. C, Weil, R. R. (2002). The nature and properties of soils. New Jersey, Prentice- Hall.
- CGWB and CPCB (2000). Status of Ground Water Quality and Pollution Aspects in NCT-Delhi, India.
- Dhirendra, M. J., Alok, K., and Namita, A. (2009). Assessment of the Irrigation Water Quality of River Ganga in Haridwar District. Rayasan, J. Chem.2 (2): 285-292.
- Doneen, L.D. (1964). Water quality for agriculture. Department of irrigation, University of California. Davis. pp. 48.
- Domenico, P.A., and Schwartz, F.W. (1990). Physical and Chemical hydrology, John Wiley and sons, New York, 410.
- Duijvenboden, Van W, Matthijsen AJCM. (1989). Integrated criteria document nitrate. Bilthoven, National Institute for Public Health and the Environment (RIVM Report No. 758473012).
- Egboka, B.C.E. and Nwankwor, G. I. (1985). The hydrogeological and geotechnical parameters as agents for the expansion of Agulu Nanka gully, Anambra State, Nigeria. Journal African Earth Science.
- Egboka, B.C.E. and Okpoko, E.I. (1984) Gully erosion in the Agulu Nanka region of Anambra State, Nigeria. In: Challenges in African Hydrology and Water Resources (Proc. Harare Symp., 335-347. IAHS. Publ. no. 144.
- Egboka, B. C, E. (1985). Water resources problems in the Enugu area of Anambra State, Nigeria. Scientific Basis for Water Resources Management(Proceedings of the Jerusalem Symposium, September 198S). IAHS Publ. no. 153.
- Eyankware, M. O., and Obasi, P. N. (2014). Physicochemical Analysis of Water Resources in Selected Part of Enugu State South Eastern, Nigeria. International Journal of Innovation and Scientific Research. (10)1:171-178.
- Eyankware, M.O., Nnabo, P. N., Nnajieze, V. S., and Akakuru, O. C. (2015). Quality Assessment of Physicochemical Attributes of Groundwater and Treated Water in Selected Parts of Enugu, Nigeria. African J. of Geo-Sci. Research. 3(2): 20-24.
- Eyankware, M. O., Nnabo, P. N., Omo-Irabor, O. O., Selemo, O. I. (2016). Assessment of the Effect of Anthropogenic Activities on Hydrogeochemical Quality of Water Resources of Ekaeru Inyimagu and Its Environs, SE. Nigeria. Sky Journal of Soil Science and Environmental Management. Vol. 5(5): 33-43.
- FAO. (1985). Guidelines. Land evaluation for Irrigated Agriculture. Soil Bull. No 55, FAO Room Italy.
- Gupta, S.K. and Gupta, I.C. (1987). Management of Saline Soils and Water. Oxford and IBH Publication Coy, New Delhi, India, pp: 399.
- Hogue, M. (1977). Petrography differentiation of tectonically controlled cretaceous sedimentary cycles, Southeastern Nigeria. J. Sediment. Geol., 17(3-4): 233-245.
- Ideriah, T.J. K. ( 2015). Assessment of Ground Water Quality for Multipurpose Use in Parts of Andoni Rivers State Nigeria. Indian Journal of Research. 4(10): 30- 40.
- Jafar A. A., Ananthakrishnan , S., Loganathan, K., and Mani, K.K (2013). Assessment of groundwater quality for irrigaton use in Alathur Block, perambalur district, Tamil nadu, India. ApplWater Sci, Springer 3:763–771.
- Joshi, D.M. Kumar A. and Agrawal, N. (2009). Assessment of irrigation water quality of River Ganga in Haridwar District India. J. chem.., 2(2): 285-292.
- Johnson, G., and Zhang, H. (1990), Classification of Irrigation water quality, Oklahoma Co-operative Extension Fact Sheets, (available at www.osuextra.com).
- McNeely, R.N., Neimanis, V.P., and Dwyer, L. (1979): Water Quality Sourcebook, A Guide to water Quality parameter. Inland waters Directorate, Water Quality Branch; Ottawa, Canada.
- Moses O. E., Desmond O. U., Effam C. S., and Obinna C. A. (2015). Physicochemial and Bacteriolgical Assessment of Groundwater Quality in Ughelli and its Environs. International Journal of Innovational and Scientific Research. Vol. 14(2): 236-243.
- Moses, O. E., Ruth, O. E. U., Oghenegare, E. E. (2016). Assessment of Impact of Leachate on Soil Physicochemical Parameters in the Vicinity of Eliozu Dumpsite, Port Harcourt, Nigeria. Basic Res. J. of Soil and Environ. Sci., 4(2): 15-25.
- Munshower, F.F. (1994) Practical Handbook of Disturbed Land Re-vegetation. Lewis Publishers, Boca Raton, Florida.
- Nata, T., Abraham, B., Bheemalingeswara, K and Tesfamichael G/yohannes. (2011). Suitability of Groundwater Quality for Irrigation with Reference to Hand Dug Wells, Hantebet Catchment, Tigray, and Northern Ethiopia. CNCS, Mekelle University. 3(2):31-47.
- Naseem S, Hamza S. and Bashir E. (2010), Groundwater geochemistry of Winder agricultural farms, Balochistan, Pakistan and assessment of irrigation water quality, European Water Publications. 31: 21-32.
- Nwaide, C.S. (1990). Cretaceous Sedimentation and Paleogeography of the Central Benue Though. In: Ofoegbu, C.O; (Ed.), the Benue. Tough structure and Evolution International Monograph Series, Braunschweig, pp. 19-38.
- Obaje, N.G. (2009). Geology and mineral resources of Nigeria. Springer Dordrecht, Heidelberg. London,pp: 211.
- Ofomata, G.E.K. (1965). Factors of soil erosion in the Enugu area of Nigeria. Nig. Geogr. J. 10 (1): 3-9.
- Ogbukagu, I.K. (1976). Soil erosion in the northern parts of Awka Orlu uplands, Nigeria. Nig. J. Min. Geol. 13, 6-19.
- Okoro, A.U., Igwe, E.O., Nwajide, C.S.(2016). Sedimentary and petrofacies analyses of the Amasiri Sandstone, Southern Benue Trough, Nigeria: Implications for depositional environment and tectonic provenance. Journal of African Earth Science. 123: 258-271.
- Oladele, M.A. (1975). Evolution of Nigeria’s Benue trough (Aulacogen): A tectonic model. Geol. Mag., 112: 575-583.
- Raghunath, H. M. (1987). Groundwater, 2nd Ed. Wiley Eastern Ltd. New Delhi, India, pp. 344-369.
- Reyment, R.A., (1965). Aspect of Geology of Nigeria. Ibadan University Press, Ibadan, Nigeria, pp: 126.
- SAI, (Spectrum Analytical Inc) (2010). Guide to interpreting irrigation water analysis, 1087 Janison Road, Washington CH, Ohio 43160 (Available: spectrumanalytic.com).
- Sawyer, C.N. and McCarthy, P.L. (1967). Chemistry for sanitary engineers. 2nd edition. McGraw-Hill, New York, 518pp.
- Schoeller. H. (1977). Geochemistry of groundwater. In: Groundwater Studies-An International Guide for Research and Practice, UNESCO, Paris, pp. 1–18.
- Stephen, R. Grattan, (2002). Irrigation Water Salinity and Crop Reproduction, Agriculture and Natural Resources Publication 8066, University of Califonia. Pp1-9.
- Talabi, A. O., Afolagboye, O. L., Tijani, M. N., Aladejana, J. A. and Ogund. (2014). Hydro-geochemistry of Some Selected Springs’ Waters in Ekiti Basement Complex Area, Southwestern Nigeria. 3(2)19-30.
- Taylor, E.W., (1958). The Examination of Water and Water Supplies. Church Hill Ltd., Press, pp: 330.
- Todd, D.K. (2001). Groundwater hydrology. Wiley, Canada, pp 280-281.
- USDA (1954). U.S.DA, Salinity Laboratory Staff., U.S. Department of Agriculture HandBook. 60, US Govt. Printing Office, Washington D.C.
- USEPA, (1987).Estimated national occurrence and exposure to nitrate and nitrite in public drinkingwater supplies. Washington, DC, United States Environmental Protection Agency, Office of DrinkingWater.
- U.S. Salinity Lab (1954) Saline and Alkali Soils- Diagnosis and Improvement of U.S. Salinity Laboratory. Agriculture Hand Book No.60, Washington.
- WHO. (1996). Guidelines for drinking-water quality, Health criteria and other supporting information. World Health Organization, Geneva. 2nd ed. Vol. 2.
- Wilcox, L. V. (1955). Classification and use of irrigation water,” USDA, Circular, Washington, DC, USA, pp. 969.
- www.who.int/water_sanitation_health/dwq/chemicals/tds.pd
How to cite this article: Eyankware MO, Okoeguale BO, Ulakpa ROE. Assessment of physico-chemical properities of surface water, of oji town and its adjoining areas, anambra basin, se. Nigeria for irrigation purpose. Galore International Journal of Applied Sciences & Humanities. 2017; 1(1): 29-43.
******